Grafana dashboards#
Note
Grafana dashboards are only available to communities on dedicated AWS clusters (and excludes CloudBank-managed accounts). If a community is on a shared cluster and would like to discuss transitioning, please contact partnerships@2i2c.org.
To find the URL to the Grafana dashboard for your community, use the List of Running Hubs table.
Note that monitoring data is retained for up to 3 years on 2i2c hubs.
Getting a Grafana account#
During the hub deployment process, 2i2c engineering will send authorized Hub Champions an email with an invitation link to Grafana to create an account. This invite link expires after seven days; and is unique to the recipient’s email address. If a new invite link is required please contact support.
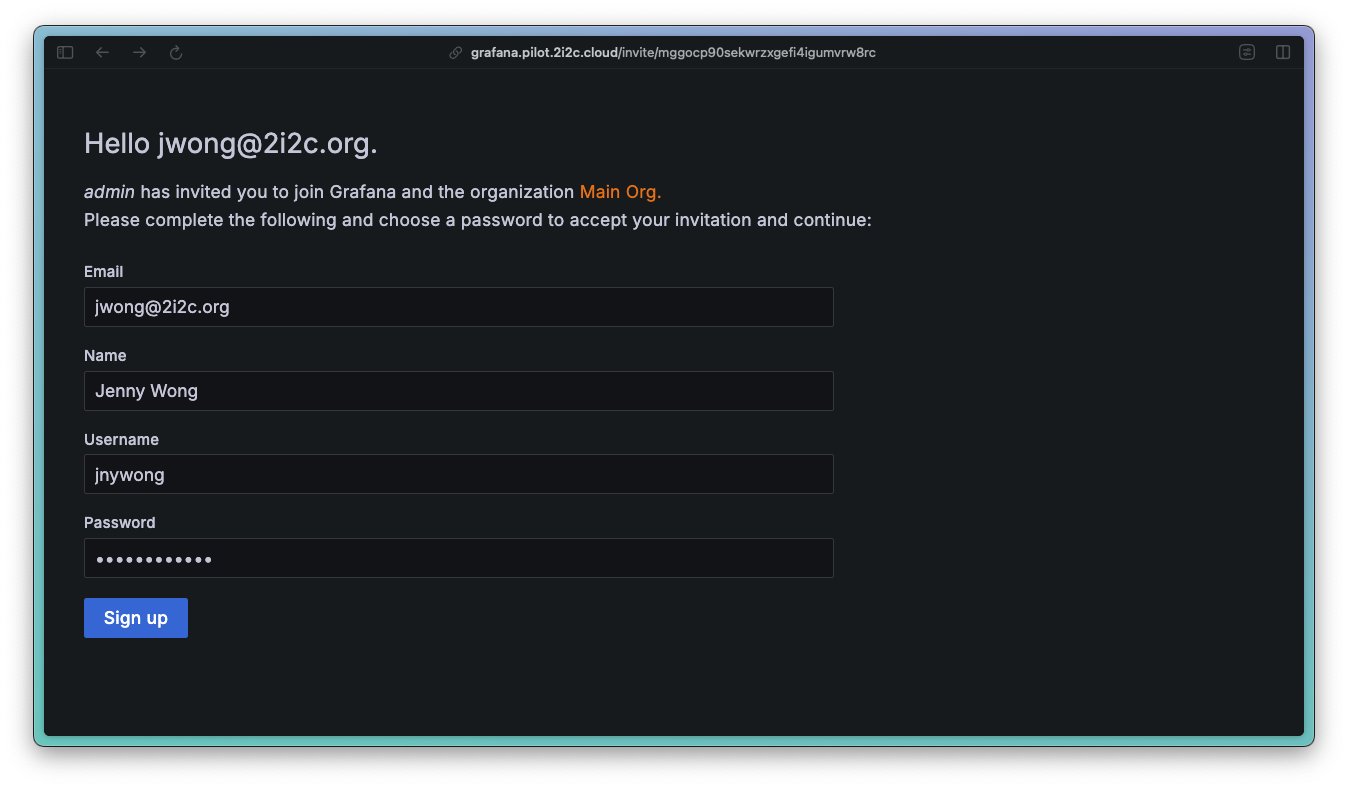
The Grafana website after clicking the invite link.#
This Grafana account is separate from the account used to log into JupyterHub. This new account has administrative privileges and will allow Hub Champions to invite other members of their community to access Grafana with admin or viewer roles.
Note
See these instructions for how to invite others to join Grafana.
Using Grafana for your JupyterHub#
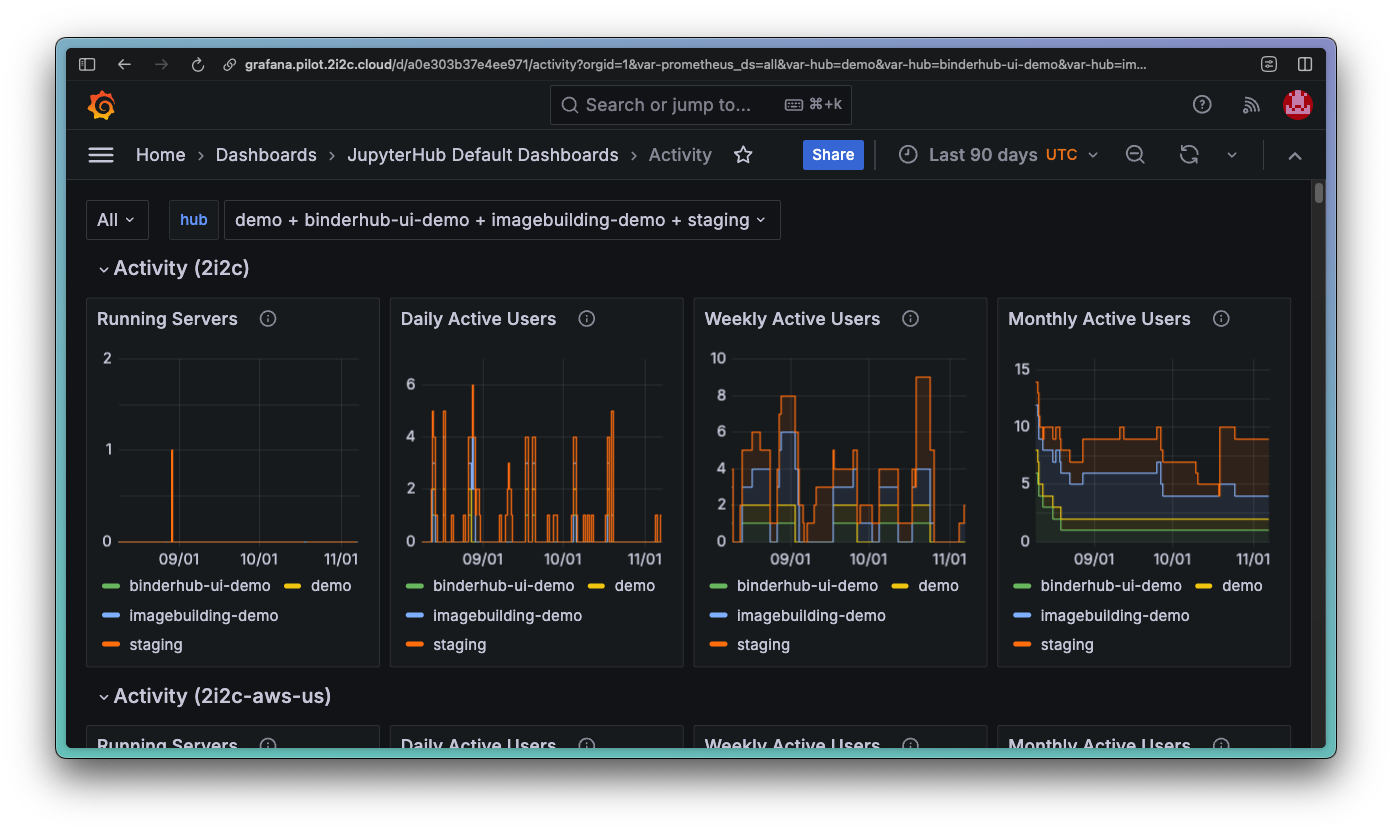
The “Activity” Grafana dashboard.#
There is work-in-progress documentation available about what each dashboard or panel represents in the upstream JupyterHub Grafana Dashboards project. You can also hover over the icon in the top-right corner of each panel for more information.
Making changes to Grafana dashboards#
If you make any changes to the pre-configured dashboards in the JupyterHub Default Dashboards and Cloud Cost Dashboards folders, then they will not be saved.
We encourage you to create new dashboards outside of these folders (however the configurations will not be backed up), or even contribute to:
the upstream jupyterhub/grafana-dashboards project for JupyterHub Default Dashboards
the 2i2c-org/jupyterhub-cost-monitoring project for Cloud Cost Dashboards
Resources#
Grafana is a powerful open source data visualization tool with many features. For more information on how to use Grafana, refer to the Grafana documentation.