User cloud costs#
Note
Available for dedicated AWS clusters only (and excluding CloudBank managed accounts). Other deployments on GCP will be supported in the future.
Understand the dashboard layout#
The dashboard is organized into several panels, each providing insights into different aspects of user cloud costs:
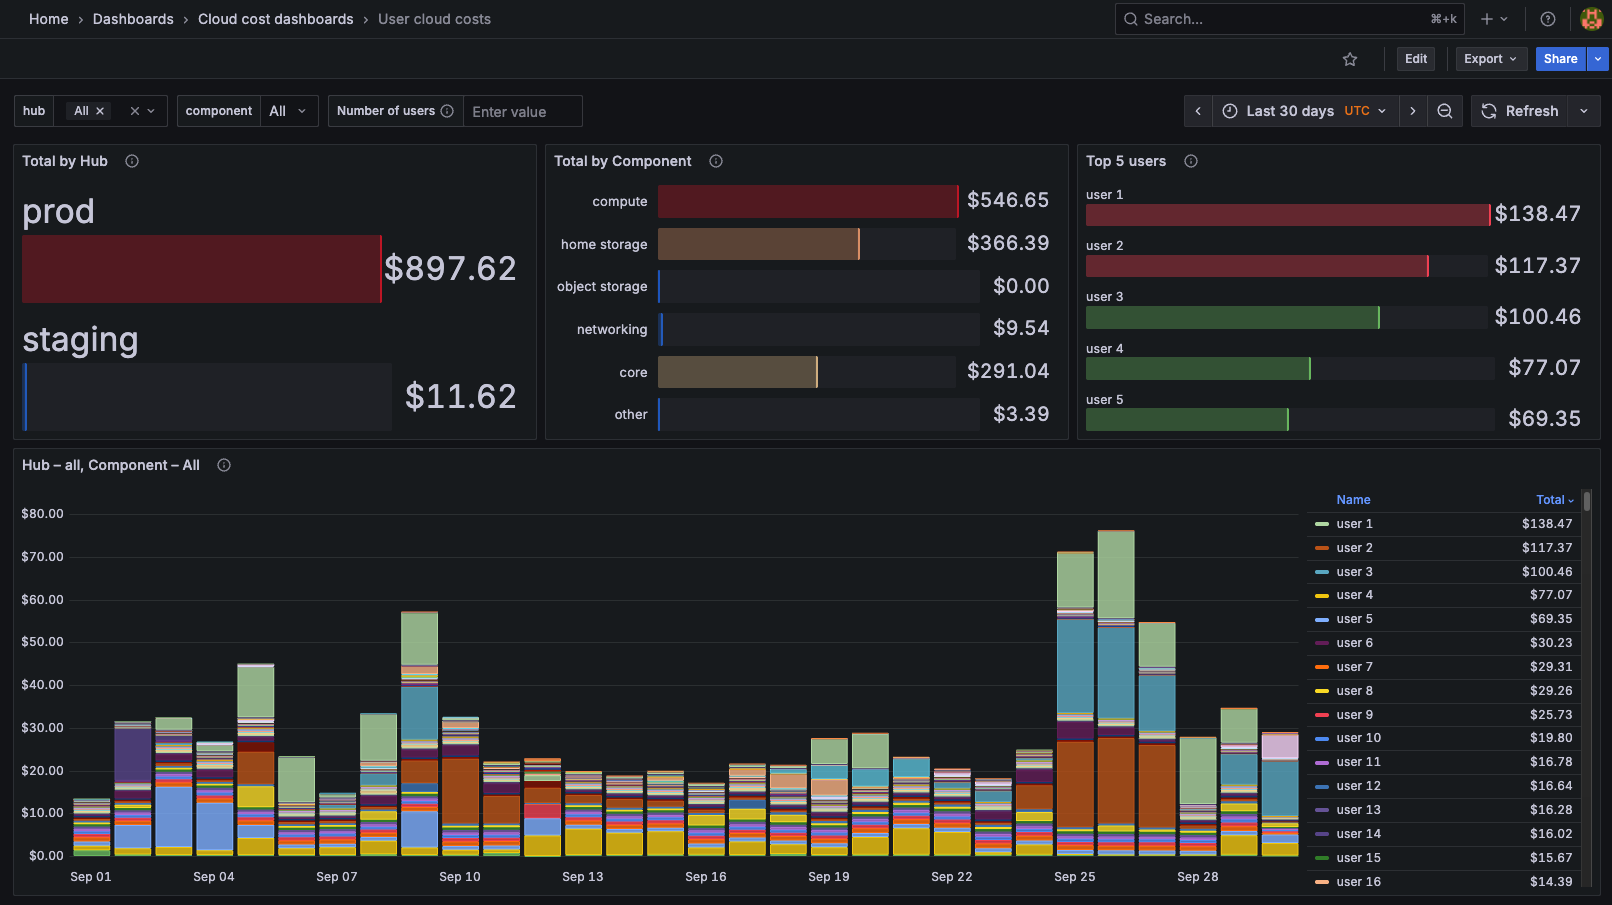
Total by Hub: a breakdown of total costs by hub, allowing you to see which hubs are incurring the most expenses.
Total by Component: a breakdown of total costs by component (such as compute, home storage, etc.), helping you identify which resources are driving costs.
Top 5 Users: a quick at a glance view of the top 5 users by total cost over the selected time range across all hubs and components.
Hub: individual panels for each hub, showing daily costs by users within that hub. User costs summed over all hubs and components are shown by default. Try toggling the variable
hubat the top of the dashboard to see splits by individual hubs or the variablecomponentat the top of the dashboard to filter by specific components.
Interact with the dashboard#
You can interact with the dashboard in several ways:
Time Range: use the time range selector in the top right corner to adjust the period for which data is displayed. The last 30 days are shown by default. The timezone is always UTC, since daily cost data prepared by cloud providers is typically settled at 00:00 UTC.
Variables: use the dropdowns at the top of the dashboard to filter data by hub or component.
Number of users: enter a number in the field to display the top N users by total cost over the selected time range.
Legend: click on user names in the legend to isolate or hide specific users in the graphs. You can select multiple users by holding down the
Shiftkey while clicking, and double-click to reset the selection.Tooltips: hover over data points in the graphs to see detailed information, including exact cost values and timestamps of each user.
Tip
Some interactions may re-trigger additional queries to fetch data, so there may be a slight delay while the graph is updated. The latest day may not have complete data, as cloud providers often take some time to finalize daily cost data.